Health GIS: We Can’t Forget About the Individual
Most GIS professionals spend a majority of their time working with data and not the individuals the data represent. This is especially true for the geospatial health scientists or health GIS analysts who spend their time developing indexes, mapping clusters of disease, or visualizing health outcomes. It’s incredibly important that we as a profession remember that the data we’re working with can represent individuals and that our analysis has the power to directly affect their lives.
East Palestine, Ohio
On February 3rd, 2023, a train carrying hazardous chemicals derailed in the small town of East Palestine, Ohio. Three days later, authorities made the difficult decision to conduct what’s called a Vent and Burn in order to prevent a catastrophic explosion. This involved puncturing the side of the tanker cars at risk of exploding, draining the chemical inside, and then burning those chemicals to dispose of them. The NTSB has since determined however, that this wasn’t necessary (see the full NTSB report here).
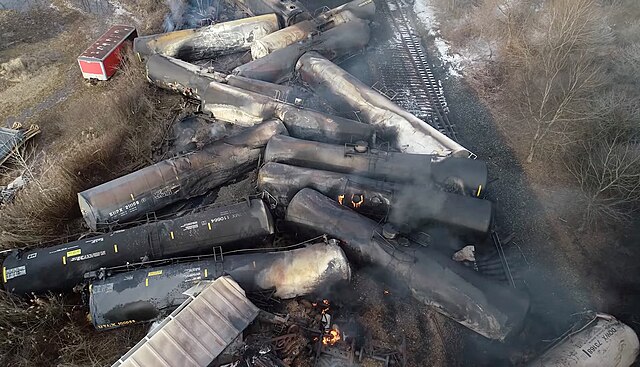
The entire event, from the initial crash and fire, to the vent and burn, to the resumption of train traffic, exposed residents to potentially harmful chemicals. At the joint request of the States of Ohio and Pennsylvania, it was the role of the Centers for Disease Control and Prevention (CDC)/Agency for Toxic Substances and Disease Registry (ATSDR) to perform an Assessment of Chemical Exposure (ACE) investigation. An ACE investigation includes a survey to identify who has been exposed, and determine the need for a long-term health effects follow-up. It was my role as a contractor at CDC/ATSDR to support the ACE in East Palestine, Ohio.
The Role of Geographic Information Systems (GIS)
Once they took the survey, we used GIS to map where they lived so we could make sure people living in the most heavily impacted areas were responding to the survey, which it turned out…they weren’t.

The primary goal of the ACE was to collect health information from individuals who could have been exposed to harmful chemicals. This was primarily done by interviewing individuals who came into a health clinic that was set up for community members. Once they took the survey, we used GIS to map where they lived so we could make sure people living in the most heavily impacted areas were responding to the survey, which it turned out…they weren’t.
GIS and location analytics were used to determine where to prioritize door-to-door survey collection, develop sampling plans for the ACE team which could be used offline to show teams the exact households they needed to reach and where they were in relation to those households, as well as track survey teams in real time. As part of the ACE team, I was able to participate in the door-to-door surveys and it transformed my view on health GIS.
It Really Is About the Individual
We traveled door-to-door with a local volunteer firefighter and an embedded CNN reporter. Initially we were told not to identify as being with the local health department instead of CDC/ATSDR but we found that once people learned we were from the CDC, they were actually much more relieved and open about their experiences. It was heartbreaking to hear what the residents of East Palestine were going through.
Generations of families uprooted, grandparents afraid to let their kids eat from their garden, and new mothers worried about the unknown health effects of the various chemicals they could have been exposed to. Being able to get out and talk to the individuals who were the subject of our maps really drove home the point that this wasn’t just some exercise, and these weren’t just aggregated statistics. They were real people, who had their lives ruined all because they lived near a set of railroad tracks.


.jpg)